The “10% exact match” rule people have been parroting since the mid-2010s is dead. So is the “branded anchors should be 70%” advice. Both ignore the only thing that actually matters in 2026: what the pages already ranking for your target keyword are doing.
Generic ratios assume every page in every niche operates under the same competitive pressure. They don’t. A locksmith homepage in Manhattan has a different anchor profile than a SaaS blog post targeting “best CRM for nonprofits,” and treating them the same is how you waste budget and trip filters.
Per-page competitive analysis is the only method I trust on client work. You pull the top 10 results, you export their anchor profiles, you find the median, then you build to that. Domain-wide averages mean nothing when Google evaluates relevance and over-optimization at the URL level. That’s the article. The rest is mechanics.
Per-Page vs Per-Domain Analysis
Anchor text optimization is a per-URL problem. Google ranks URLs, not domains, and the over-optimization signals tied to anchor patterns get measured against the specific page receiving the links.
Send 50 exact match anchors to your homepage and 0 to your /services/water-damage-restoration/ page, and the inner page won’t have anchor-over-optimization issues at all because it has no anchors. The homepage might be cooked. For planning purposes, treat them as separate calculations.
This breaks the way most agencies still operate. They look at total domain backlinks in Ahrefs, calculate one big ratio, and call it a day. That number is meaningless for campaign planning. It tells you nothing about whether your money page is over-optimized for its target keyword or whether it has enough partial match anchors to rank.
Homepages and inner pages live in different competitive contexts. A homepage usually targets the brand name plus maybe one fat-head keyword. The competitive set for a brand search is dominated by branded anchors because that’s what people naturally link with. Send too many exact-match commercial anchors there and you stand out in a way you don’t want.
Inner pages are different. A page targeting “commercial roof repair Phoenix” sits in a competitive set where the top 10 are all aggressively optimizing that exact phrase or close variants. Branded anchors barely exist for those URLs because nobody naturally links to a service page using its commercial keyword.
I ignore the domain-level number entirely on most campaigns. I pull the target URL, I pull its competitors, and I treat that as a closed system. The only time domain-level matters is when the entire site has a structural anchor problem, which is a different conversation than per-page optimization.
Each money page gets its own ratio target. Each one. No shortcuts.
Homepage vs Inner Page Anchor Ratios
The numbers I’m about to give you are starting points. They get adjusted per niche based on the actual competitive data. But these are the ranges I see hold up across most commercial verticals after pulling hundreds of competitor profiles.
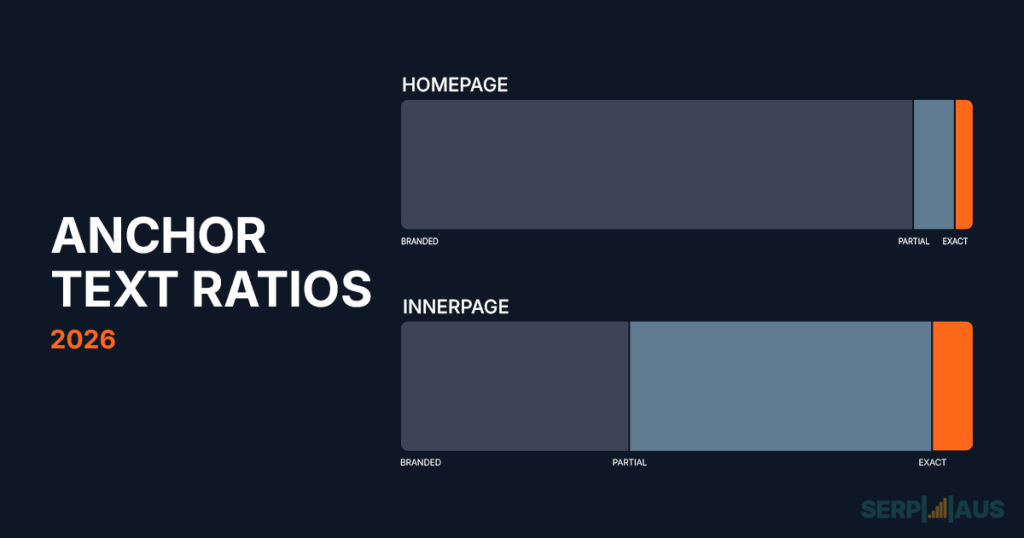
- Branded, naked URL, generic combined: 80-95%
- Partial match: up to 10%
- Exact match: 5% or less
The reasoning is simple. Real branded sites get linked with their brand name. “Brand X,” “BrandX.com,” “click here,” “this site,” “the company.” That’s how human linking actually works when it’s organic. When you see a homepage with 30% exact-match commercial anchors, you’re either looking at a manipulation attempt or a site with serious anchor problems waiting to compound.
Naked URLs (just the domain pasted as anchor) carry weight here. They look natural because they are natural. Forum mentions, citation profiles, and most editorial links default to either brand or naked URL.
- Partial match: 50-60%
- Branded, naked, generic combined: 35-45%
- Exact match: up to 10%
Partial match anchors are the workhorse for inner page rankings. Phrases like “best plumber for emergency calls” when targeting “emergency plumber,” or “guide to commercial roofing options” when targeting “commercial roofing.” They tell Google what the page is about without screaming exact-match.
The 50-60% partial match range looks aggressive compared to homepage advice but it’s normal in competitive commercial niches. Pull the top 10 for almost any high-intent keyword and you’ll see partial match dominate.
Exact match still works at up to 10%. Some pages tolerate 15% or more depending on domain age and overall profile health. I lean conservative because the downside of over-optimizing exact match is heavier than the upside of squeezing an extra few percent.
Why the difference matters strategically: a homepage anchor strategy built on inner-page ratios will get the entire site flagged. An inner page anchor strategy built on homepage ratios will never rank. Different optimization problems, different risk profiles, different percentages. Adjust based on what you actually see in the SERP, but use these as your default starting frame.
The Step-by-Step Competitive Calculation Method
The actual workflow is simple. Most agencies skip it because it takes 30-45 minutes per target URL and they’d rather copy a generic ratio. Their loss.
Step 1: Identify your top 10 competitors for the target keyword
Search the keyword incognito from the target geo. Document the top 10 organic results. Skip ads, skip featured snippets that link to your own site, skip Reddit/Quora/YouTube results that won’t have comparable backlink profiles. You want the same kind of result your client’s URL is competing for: commercial pages, service pages, or content pages depending on intent.
If 3 of the top 10 are giant brands like HomeDepot or Forbes, exclude them. Their anchor profiles are skewed by domain authority you’ll never replicate. Find the closest 7-8 comparable competitors and work with that.
Step 2: Export anchor data per URL
In Ahrefs Site Explorer, paste the competitor’s specific ranking URL (not the domain) and switch to URL mode. Open the Anchors report. Export as CSV. Repeat for every competitor in your set.
You should have 7-10 CSV files. Each one represents the anchor distribution of a single ranking URL. The Backlinks count next to each anchor tells you how many referring pages use it.
Step 3: Categorize every anchor
Run each export through your categorization. The buckets I use:
- Branded: brand name only, brand variations, “BrandX official”
- Exact match: the target keyword word-for-word
- Partial match: keyword variations, related phrases, longer phrases containing the target
- Naked URL: brand.com, https://brand.com, brand.com/page
- Generic: “click here,” “read more,” “this article,” “source”
- Misc/other: image links with no alt, non-English anchors, gibberish
Get the total backlink count per category. Calculate each as a percentage of total backlinks for that URL. You now have one row of percentages per competitor.
Step 4: Find the median and mean
Stack all competitor rows in a Google Sheet. Calculate both median and mean for each anchor type column. Median matters more than mean because one outlier competitor with 5,000 forum links can wreck the average.
The median branded percentage is your branded target. Same for partial match, exact match, and the rest. This is the ratio your target URL should converge toward, not the generic 70/20/10 some blog post suggested.
Step 5: Apply conservative adjustments
The median is the SERP norm, not necessarily where you want to land. Two adjustments I make:
Pull exact match down by 25-30%. If the median is 12% exact match, target 8-9%. The cost of over-optimization in 2026 is too high to sit at the median when you can rank slightly below it.
Pull partial match toward the upper median. If competitors range from 45-65%, aim for the 60-65% end. Partial match anchors carry topical relevance signal without the over-optimization risk of exact match.
Step 6: Build your campaign plan
Calculate the gap between current anchor distribution and target distribution. That gap tells you exactly what anchor types to build over the next 60-90 days, and roughly how many.
Example math: if the target URL needs 40 more partial match anchors to hit 55% partial match ratio after the campaign, that’s 6-7 partial match links per week for 6 weeks. Build to the gap, then re-pull the data and recalibrate.
That’s the whole process. Anyone telling you to just shoot for 60% branded is selling generic advice, not strategy.
2026-Specific Anchor Strategy Considerations
Google in 2026 doesn’t just count percentages. The March 2024 spam and core update, the link-spam pushes in mid and late 2024, and the August 2025 spam update, plus the rolling core updates through 2025 and into 2026, baked in stronger pattern recognition that catches things raw ratios miss.
Pattern over percentage
Building 8% exact match anchors is fine. Building 8% exact match anchors that all use the identical phrase, all drop within a 2-week window, all come from sites with similar IP footprints, and all sit in the same paragraph position on the linking page is not fine. The percentage is the same. The pattern is what gets flagged.
I assume Google clusters anchor patterns by drop velocity, exact phrase repetition, linking-domain similarity, and surrounding text context. Vary all four. If your campaign produces 12 partial match links per month and they all use 3 phrasings, you’ve built a fingerprint.
Impact of 2024-2026 updates
The spam updates in June and December 2024, plus the August 2025 spam update, hit ratio-perfect profiles built through automated services hard. Plenty of sites had textbook 70/20/10 distributions and still got nuked because the timing and source patterns gave them away. Sites that survived had messier-looking profiles with organic-feeling distribution: clusters of branded mentions during PR cycles, partial match accumulating slowly across editorial coverage, exact match present but inconsistent.
Lesson: optimize for the pattern of accumulation, not just the ending ratio.
Established domain tolerance
The ranges below are working tolerances based on what I’ve seen across dozens of sites, not official thresholds. Most public guides still cap exact match at around 10-15% as a blanket rule; in practice, stronger domains can sit higher if everything else in the profile is clean. Your mileage will vary.
- 12-year-old domain, 5,000+ RDs: tolerates up to 15-18% exact match in edge cases
- 3-year-old domain, 500-1,000 RDs: tolerates 8-12% exact match
- 6-month-old domain, under 100 RDs: at risk above 5-6% exact match
A 12-year-old domain with 5,000 referring domains can sit at 15-18% exact match without much risk because the rest of the profile absorbs it. A 6-month-old domain with 80 referring domains gets nuked at 8% exact match because there’s nothing to dilute the signal.
Domain age, referring domain count, organic traffic baseline, and historical anchor velocity all factor in. I use these as multipliers on the conservative side of competitive ratios for newer or weaker sites: shave another 30-40% off exact match, push partial match harder, lean heavily on branded and naked.
Topical context and timing
The surrounding paragraph and the topical relevance of the linking page now matter more than the anchor itself in some cases. An exact match “commercial roofer Phoenix” anchor from a Phoenix construction blog post about roofing options reads natural. The same anchor from a generic business directory reads manipulated.
Build for context. Build for varied timing. The ratio is the floor of the strategy, not the ceiling.
Common Anchor Ratio Mistakes I See Agencies Make
Using generic industry benchmarks
The “70% branded, 20% partial, 10% exact” rule was reasonable in 2017. It’s been parroted since by people who never tested it against current data. Real competitive niches show distributions that look nothing like that. Stop using it. Pull your own data.
Domain-level analysis instead of per-URL
Most agencies look at the entire domain’s anchor profile in Ahrefs Overview and base recommendations on that single number. It’s a category error. Page-level optimization requires page-level data. The domain number tells you almost nothing about whether your money page is in trouble or under-optimized.
Predictable monthly patterns
Some VAs and agencies build the same anchor type at the same volume every month. 5 exact match, 10 partial match, 15 branded, repeat. Google doesn’t need to be especially smart to catch that pattern across 12 months of timestamped link drops. Vary volume, vary types per month, throw in entire months that are 90% branded with no commercial anchors at all.
Ignoring link quality for ratio targets
Hitting a ratio target with garbage links is worse than missing the ratio with quality links. A 6% exact match anchor profile built on PBN trash and forum spam will outperform a 10% profile built from contextual editorial placements only in the short term, and only if Google doesn’t catch the source pattern. Over 6-12 months, quality wins. Link quality and anchor ratio are not separate optimizations; they interact.
Treating ratios as static
Competitive ratios shift. The SERP your client is targeting today won’t have the same anchor distribution in 6 months. Re-pull competitor data quarterly on active campaigns. Recalibrate your targets. Your 2026 Q1 ratio target shouldn’t still be your Q4 ratio target.
Tools and Workflow for Anchor Analysis
Ahrefs Site Explorer is what I use. The Anchors report at the URL level is the cleanest data source for this kind of analysis. Export limits are generous on the standard plans, and the categorization is granular enough that you don’t lose precision in the export.
Majestic works as a backup or cross-reference. Their Trust Flow data layers nicely on top of anchor analysis when you want to filter for high-quality anchors versus all anchors. The interface is clunkier but the dataset is solid.
SEMrush has improved their backlink tools significantly through 2024-2025 but still feels secondary to Ahrefs for this specific use case. Use it if it’s already in your stack. Don’t subscribe to it just for anchor analysis.
- Row 1: Anchor type categories as columns
- Rows 2-11: One row per competitor with their percentages
- Row 12: Median formula across competitors
- Row 13: Mean formula across competitors
- Row 14: Conservative target (median minus exact match adjustment)
- Row 15: Current anchor distribution for the client URL
- Row 16: Gap (target minus current) – drives the campaign
The gap row drives the campaign. Update current distribution monthly as new links land and recalculate the gap. When the gap closes, the campaign is done for that URL.
For PBN networks specifically, I track planned anchor types per link order before assigning them, against the target ratios. Stops the VA from accidentally building 4 exact match anchors in a row to the same URL.
The Bottom Line on 2026 Anchor Ratios
Anchor text optimization in 2026 is competitive analysis with risk control on top. Skip the generic ratios. Skip the domain-level averages. Pull the top 10, export the anchors, find the median, adjust conservatively, build to the gap.
Treat ratios as guardrails, not targets. The real goal is matching the SERP norm closely enough to avoid pattern flags while building enough relevance signal to outrank. Both halves matter. One without the other gets you ranked nowhere or penalized.
Do this per URL. Do this every quarter. Stop copying SEO blog posts from 2015.